4 Use Cases
Every device powers multiple simultaneous use cases. We call this use case stacking. This is different from re-using or re-purposing a device. With use case stacking, multiple applications run concurrently. The supported use cases depend on the sensors attached. The two main public health use cases only need the base set of sensors, which means anybody with an account can get hyperlocal heat risk and mosquito abundance information.
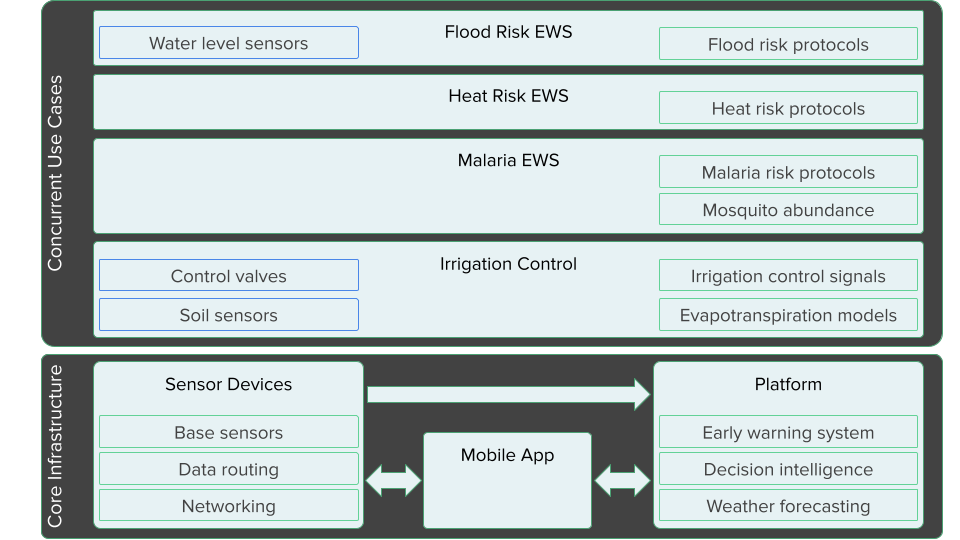
Figure 4.1: The CADP provides a common infrastructure that powers multiple concurrent applications. Green boxes indicate components that only need to be built once. Blue boxes are components that are installed at each site. Every use case can leverage sensor data produced by other use cases, increasing the return on the infrastructure investment.
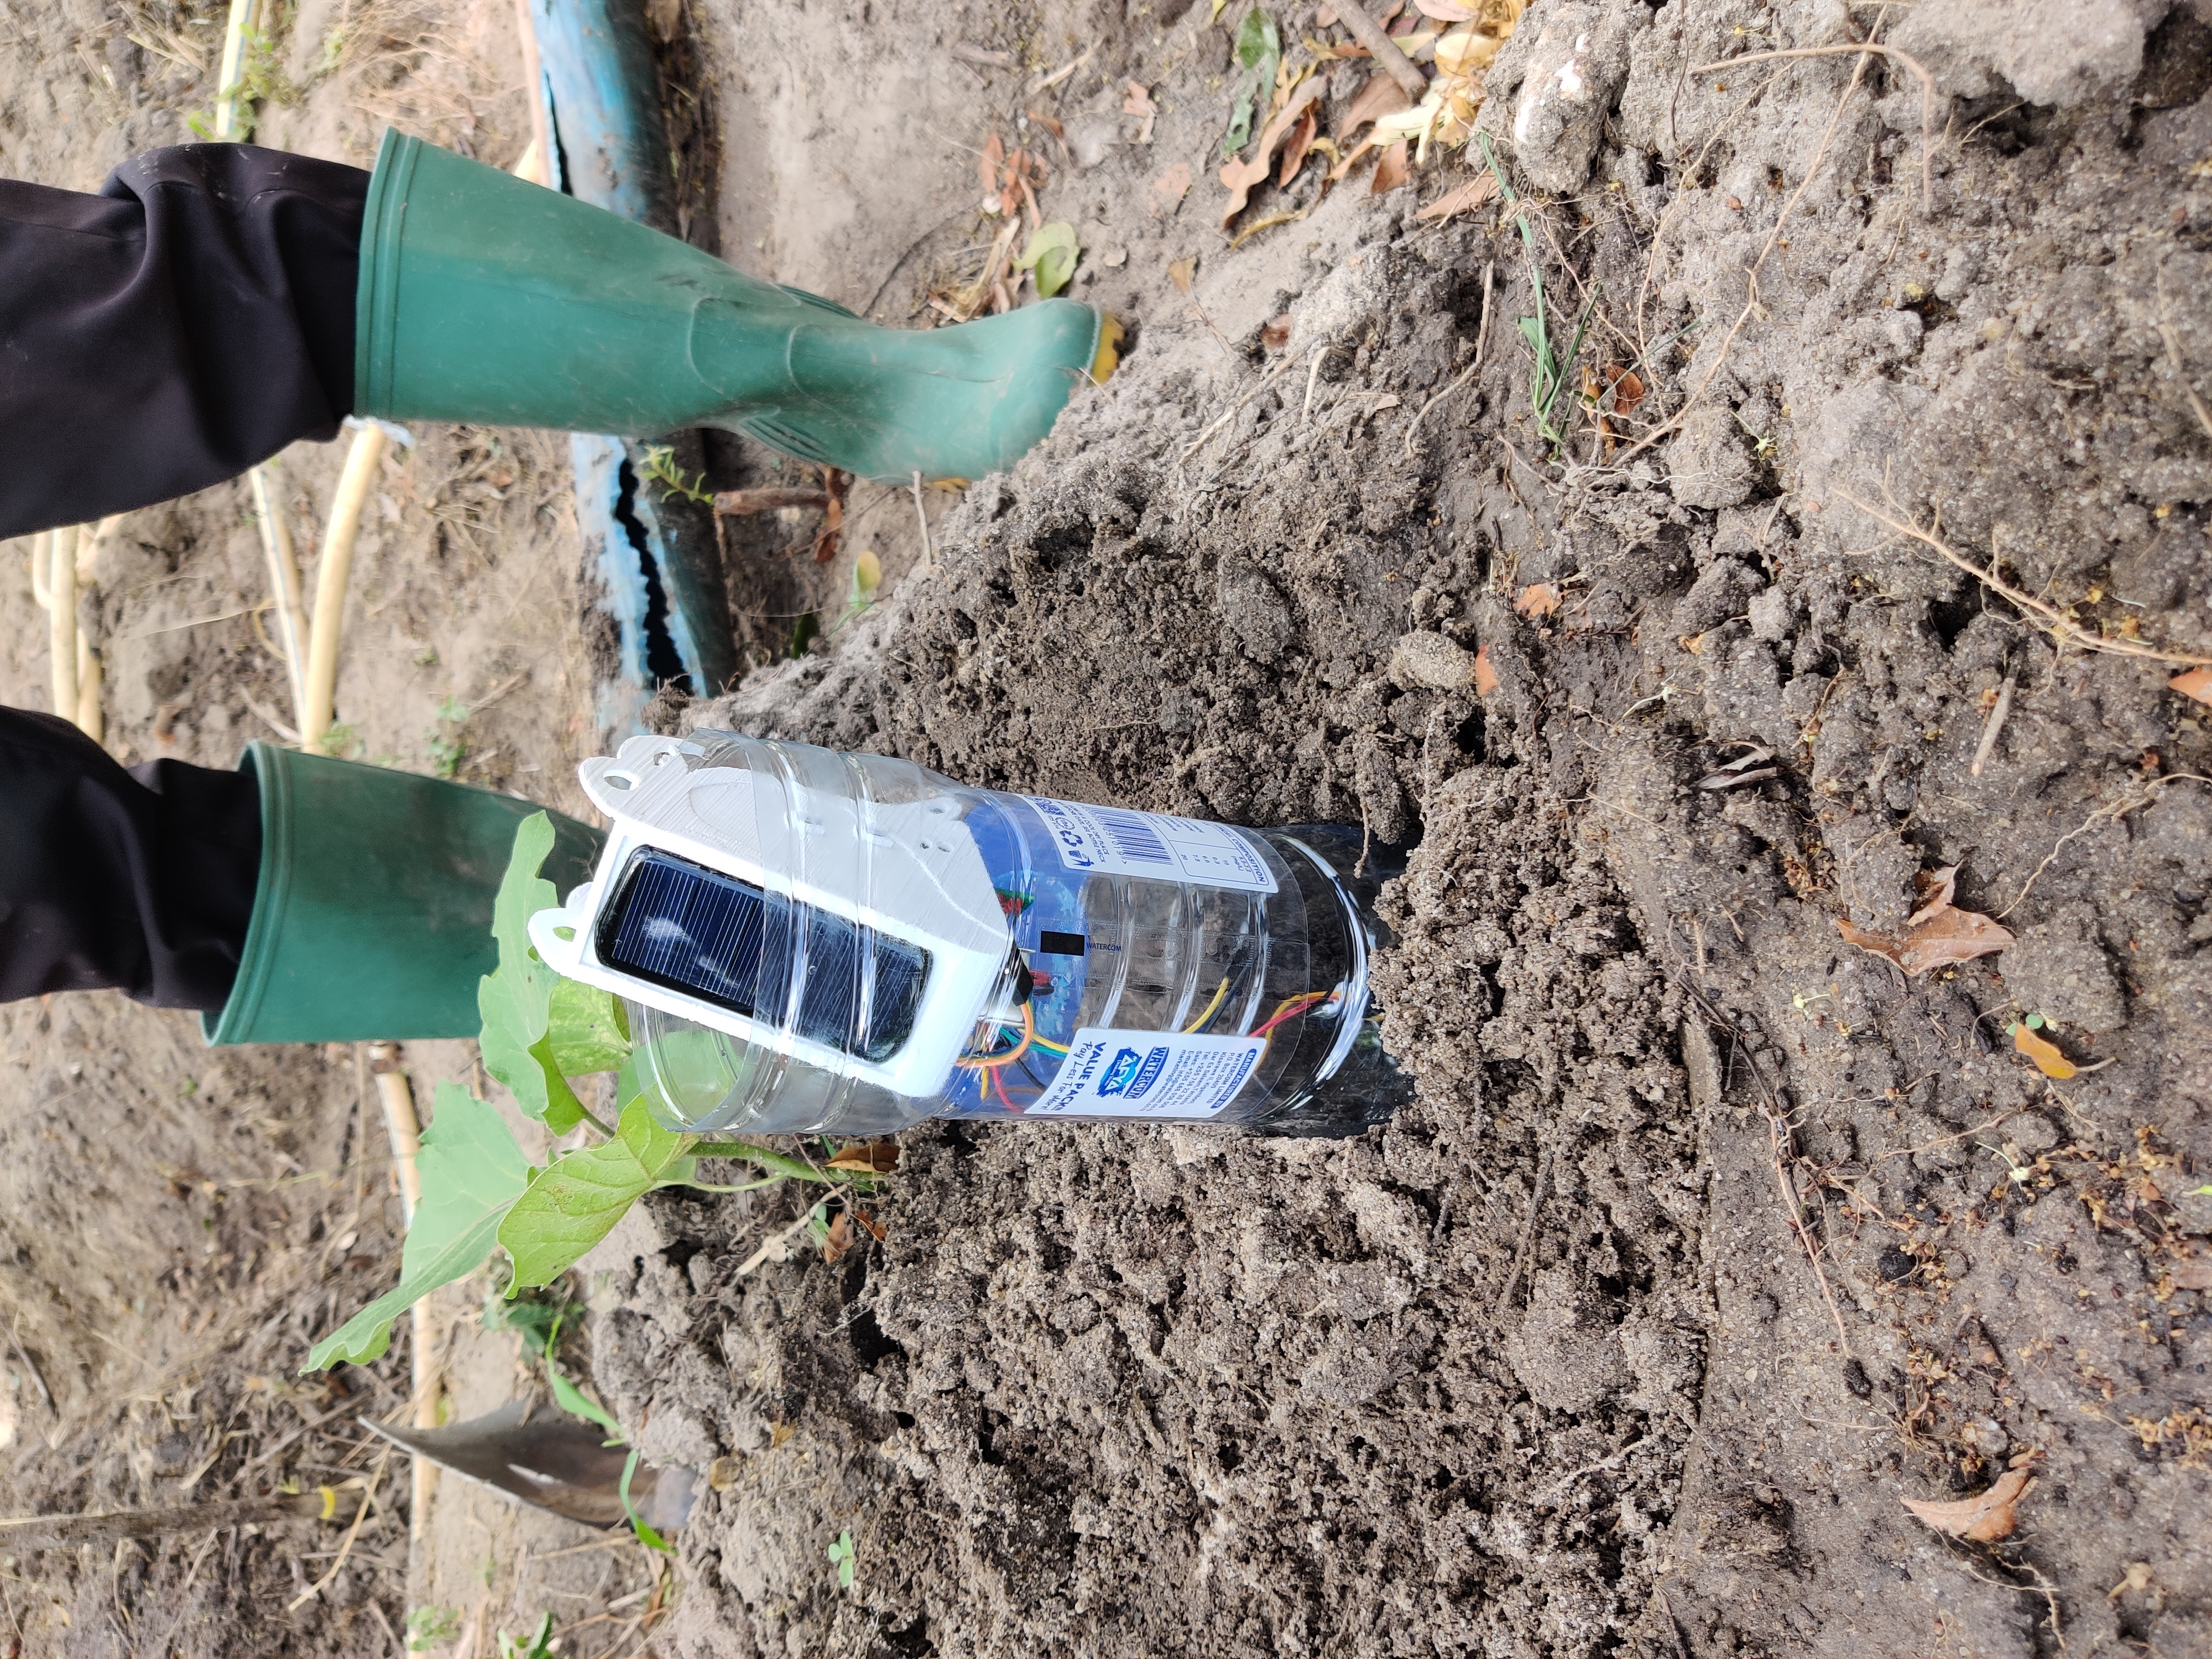
Figure 4.2: A prototype weather station device deployed at the University of Dar es Salaam test farm in Tanzania.
4.1 Public health
4.1.1 Early warning systems
The genesis of this project was the death of 11,000 people in Libya due to a medicane (Mediterranean hurricane) that caused a dam to fail. People were caught off guard because as a failed state, Libya has no functioning weather agency. It turns out that most of Africa has limited weather stations. Most official weather agencies only send out seasonal forecasts.
Weather forecasts give people critical time to plan and prepare for major weather events. Building on top of weather forecasts are early warning systems (EWS). These systems apply rules, or risk protocols, to forecasts to determine the level of risk people are exposed to. EWSes can operate on any type of forecast and includes heat risk, air quality risk, the spread of wildfire, the spread of infectious disease, and the spread of pests like the ash borer.
The UN declared a mandate that everyone should be covered by an early warning system by 2030. Some $3 billion dollars have been earmarked for this effort. While many countries have early warning systems, many are outdated, no longer work, or cover a limited number of risks.
The CADP provides the infrastructure to quickly build EWSes and fulfill the UN’s vision.
4.1.2 Heat risk
Survivability is the upper limit of temperature and humidity that humans can withstand. Humidity has a significant impact on the maximum temperature that humans can survive in. With high humidity, the body loses its ability to regulate temperature via perspiration.
In some places, climate change is making heat waves more extreme and pushing temperatures to the survivability level. Even if that limit isn’t reached, whether those conditions are livable is another matter. Livability limits help people understand what activities are possible given temperature and humidity (and sun exposure). Figure 4.3 compares livability limits for two population groups and whether the activity takes place in direct sun or shade.
![Livability limits for different METs at different temperature and humidity levels. Source: [@vanos2023]](images/livability_limits.png)
Figure 4.3: Livability limits for different METs at different temperature and humidity levels. Source: (Vanos, Guzman-Echavarria, and Baldwin 2023)
The conversion formula between METs (\(M\)) and calories is \[\begin{align} M \frac{3.5 m}{200} = kcal/min, \end{align}\] where \(m\) is mass in kilograms. This formula enables us to customize the heat risk of specific activities according to each individual and their specific health conditions.
Heat risk builds on the concept of livability. The goal is to provide an EWS that helps people understand their heat risk exposure and make decisions about what activities to do or how to mitigate heat risk during certain activities. As shown in 4.4 the platform currently highlights risks
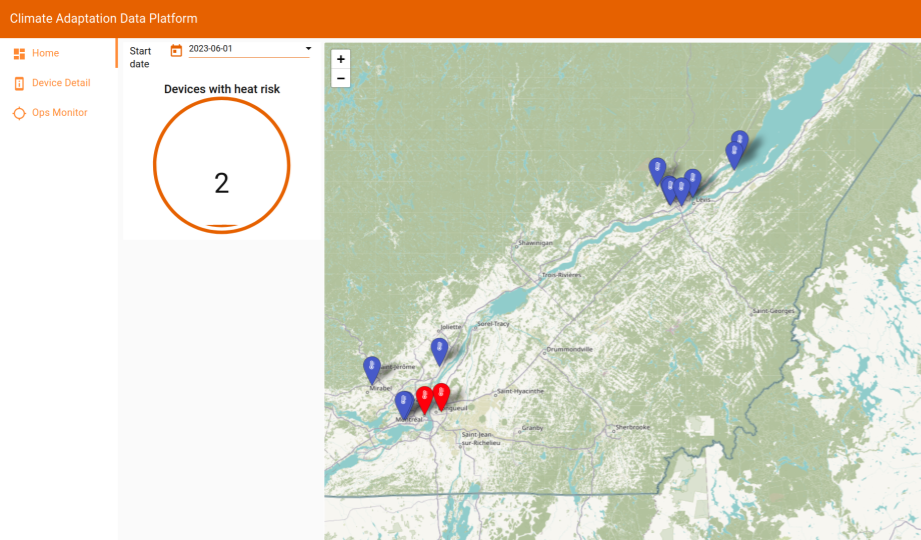
Figure 4.4: A screenshot of a policy dashboard showing active heat risk alerts for two devices.
Individuals can get personalized heat risk guidance for any device in CADP. Alerts can be delivered via email or via the mobile app. Users can enter some health information to get better alerts. This information is saved but segregated from personally identifiable information (PII).
Relevant health information includes
- age
- BMI (weight + height)
- diabetes
- heart issues
We envision a conversational alert message that doubles as a daily planner. Integrating this information with preferred activities results in specific messaging that informs people of what activities are realistic for a given day. On a very hot and humid day, an older person may want to limit sun exposure to an hour. That might mean that golf should be avoided, whereas a stroll through a shaded park is more appropriate.
4.1.3 Mosquito-borne infectious disease
Mosquitos are a common disease vector and can carry numerous infectious diseases, such as malaria, dengue fever, zika virus, yellow fever. Disease outbreaks are driven by the growth of a mosquito population. To limit the severity of an outbreak, mosquito surveillance is conducted to monitor the spread of mosquitos. By tracking mosquito abundance, it is possible to predict how large an outbreak might be.
Direct observation of mosquitos is an involved process. It requires specialized devices to attract and trap mosquitos. Usually these devices need periodic cleaning.
A simpler approach is to use a mosquito abundance model and build risk protocols on that model. These can be calibrated with physical traps (future). Figure 4.5 shows a system of partial differential equations (PDEs) that describe the change in mosquito abundance given a few parameters. Of importance is that both temperature and humidity drive the population growth of mosquitos.
![A system of partial differential equations that model mosquito population growth based on environmental conditions. Source: [@erraguntla2021]](images/mosquito_abundance_pdes.png)
Figure 4.5: A system of partial differential equations that model mosquito population growth based on environmental conditions. Source: (Erraguntla, Dave, and Zapletal 2021)
We can thus use the temperature and humidity forecasts available in the CADP to make mosquito abundance forecasts. Figure 4.6 shows a graph of a device in the CADP. The green line represents observational data, while the orange time series is the forecast produced by the CADP.
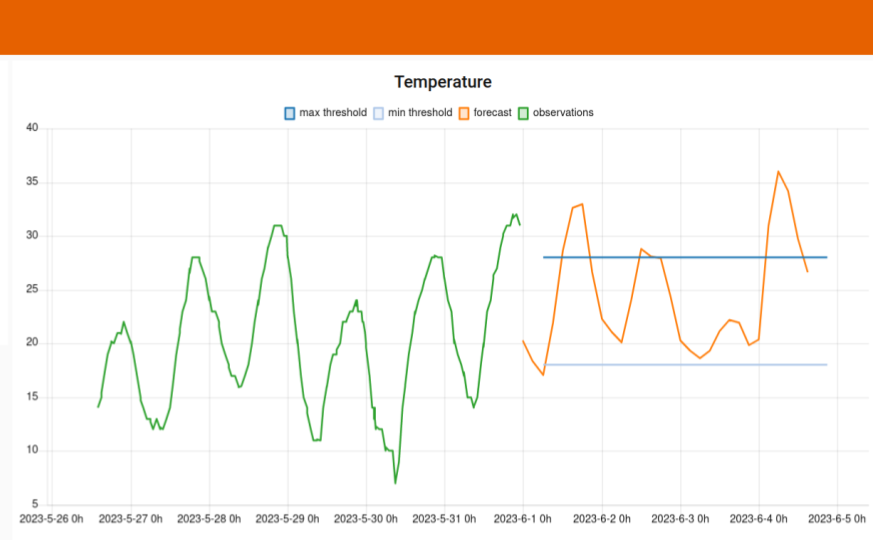
Figure 4.6: A device detail view showing historical temperature, a temperature forecast, plus heat risk thresholds.
4.2 Precision agriculture
Helping farmers increase food security in Africa was the genesis of this project. Optimizing water used for irrigation is one way that precision agriculture can increase food security. Unfettered irrigation has emptied aquifers across the world. When aquifers are depleted, rainfall becomes a more prominent source of water. Areas that rely on rainwater for irrigation are particularly threatened by changing climates.
Minimizing water usage also improves public health. Many areas rely on rain water as their primary potable water source. That means irrigation is often competing with personal hydration for water. Optimizing water usage means there can be sufficient water for both needs.
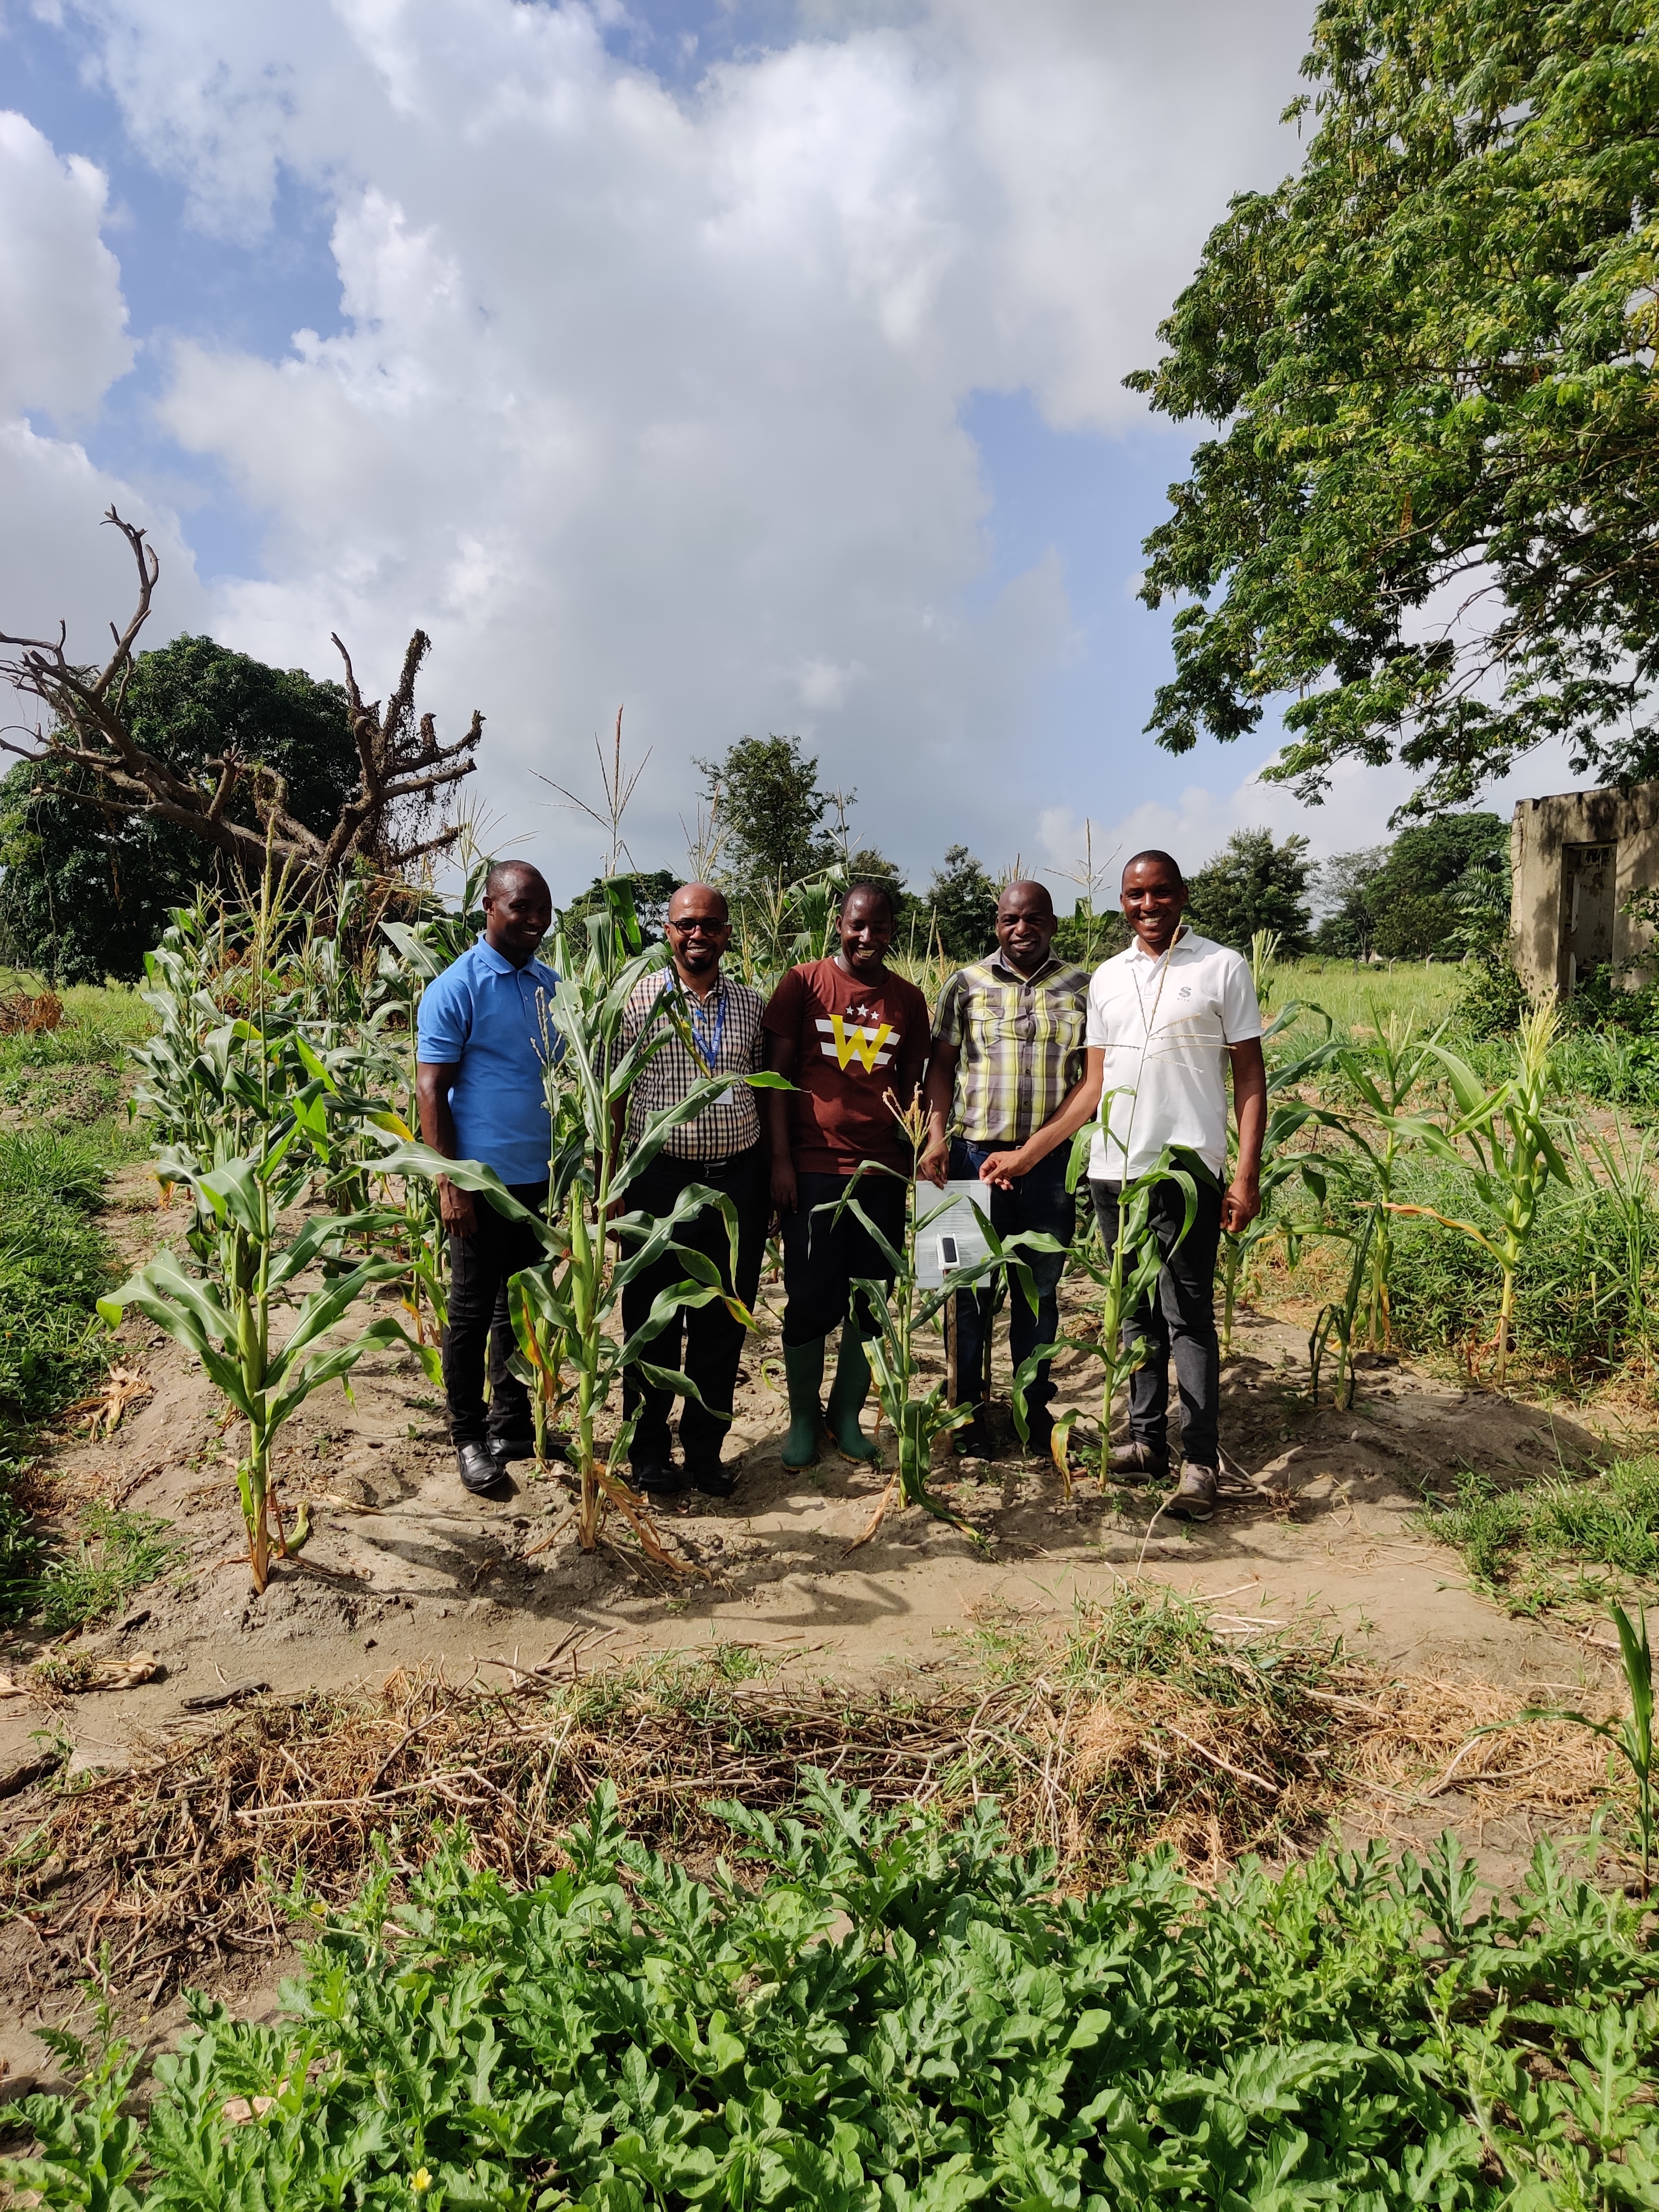
Figure 4.7: UDSM professors and agronomy staff standing behind a prototype weather station device.
Our goal is to make precision agriculture accessible to smallholder farmers worldwide. We accomplish this by making the technology easy to use and affordable. To simplify the deployment process and ensure success, irrigation control can be divided into three milestones that build on each other. Illustrated in 4.8, the first stage is signaling when there will be dry soil. The goal is to ensure plants do not dry out. This step is good to get comfortable with the forecasting accuracy of the system and develop confidence that it behaves correctly. Just a single device with a soil moisture sensor is required. It can be placed in a garden bed that gets fairly even watering.
In the second stage, an evapotranspiration model is applied to the device data. Evapotranspiration models are crop specific and determine the amount of water a plant loses due to evaporation (from soil) and transpiration (from leaves). By incorporating this model, plants can receive the optimal amount of water they need, not just prevent dry conditions. There should be noticeable improved yield at this stage. This step requires one device per crop.
The final stage brings water control into the system. The first two stages still require human intervention to actually water plants. The final stage is nearly fully automated, with the exception of the water source. (With additional sensors, the system can prevent pumping if no water is available.) In addition to a water source, stage 3 requires along with a pump, tubing, and water valves. Water flow meters can also be added to monitor the water usage.
Automated irrigation control removes the guesswork of watering. With continuous monitoring the system knows how much water is available to the plant. Using the integrated evapotranspiration models and sensor data, the system knows how much water plants need and can provide that precise amount. The end result is optimal growing conditions that can improve yield while reducing the work required to manage the crops.
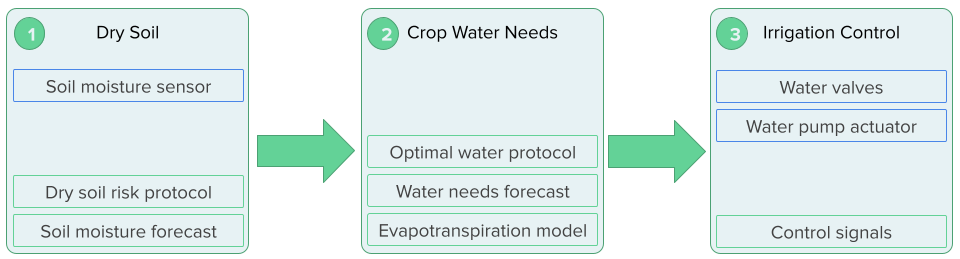
Figure 4.8: Precision irrigation control can be phased in over three key stages. Stages use a combination of pre-built software components (green) and site-specific hardware components (blue). In the first stage, a single device can monitor a garden. In the second stage, one device should be allocated per crop. In the final stage, pumps and valves are added to control water supply to individual crops.
4.2.1 Dry soil forecasting
Forecasting dry soil is the first step in irrigation control. Soil that is either too dry or too wet can be harmful to plants. While the optimal amount of water is specific to each plant, preventing over and underwatering can be accomplished simply by monitoring soil moisture.
A soil moisture forecast can notify the farmer or gardener when soil needs watering. By waiting for a watering signal, this approach avoids overwatering, which conserves water.
The deployment model shown in Figure 4.9 is relatively simple. A single sensor device is required that has a soil moisture sensor attached to it.
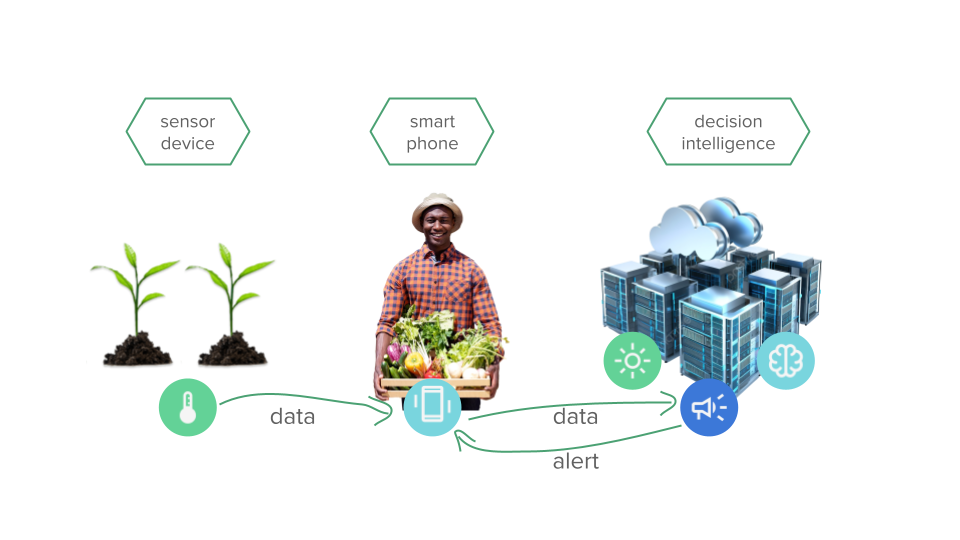
Figure 4.9: A simple installation where a single device monitors soil moisture for a crop.
Prior to deploying devices, the following tasks must be completed:
- Count distinct garden areas to monitor. It’s fine to start with one small area or count all distinct crops in contiguous areas.
- Identify Internet connectivity:
- WiFi connection via fixed Internet connection
- cellular connection via smartphone
If Internet connectivity is only available via a smartphone, see Chapter 6 that discusses the corresponding mobile app.
The actual installation is simple: just mount the device at least a 30 cm (12") above the ground and push the soil sensor into the earth.
4.2.2 Crop water needs
Every plant has its own water needs. In addition to the crop, the amount of water needed further depends on the maturity of the crop. Beans need moist soil when pods are forming. Beets should receive minimal water during early growth stages to promote root development.
Crop calendars, such as depicted in Figure 4.10 show the planting season and basic growth stages of different crops.
![Crop calendars for Kenya. Source: [@usda1]](images/eafrica_ke_calendar.png)
Figure 4.10: Crop calendars for Kenya. Source: (“Crop Calendars for East Africa,” n.d.)
More precise water needs are provided by evapotranspiration models. Evapotranspiration tells us how much water is transferred to the atmosphere. We can use these models to estimate how much water plants need to stay healthy. By combining these models with our sensor data, we can minimize the amount of water needed for irrigation.
We use the approach defined by Brouwer and Heibloem (1986) that determines water need based on evapotranspiration \(ET_o\) and a crop factor \(K_c\):
\[ ET_{crop} = ET_o K_c \]
The reference evapotranspiration variable is computed per device based on local climatic factors.
Whether a crop needs water on a given day depends on the daily water need and the current moisture content of the soil. If the soil is too dry, it cannot provide the moisture the plant requires. Under this situation, the plant would require watering. However, we don’t necessarily want to water crops if we know it will rain in the next few days. The water needs model thus incorporates this information to provide an explicit signal how much water is required.
The following additional tasks are required prior to activating this stage:
- Identify a reliable water source
- Determine how often water can be applied in days (e.g., every day, every 2 days, etc.)
- Assign someone to be responsible for watering the plant
No additional sensors are required for this stage. The primary requirement is to ensure someone can physically water plants when they need water.
If testing the benefit of the system, it is highly recommended that a control group exists that follows the existing watering protocol. The control group makes it easier to compare the differences between the two techniques.
4.2.3 Irrigation control
Automated irrigation control builds on top of the water needs forecasting model. This system introduces pumps and flow sensors to control and monitor the flow of water through tubing or pipes. For areas with limited infrastructure, we recommend using small pumps with minimal power needs. These can be deployed one per device to enable precise control of the watering for a single crop.
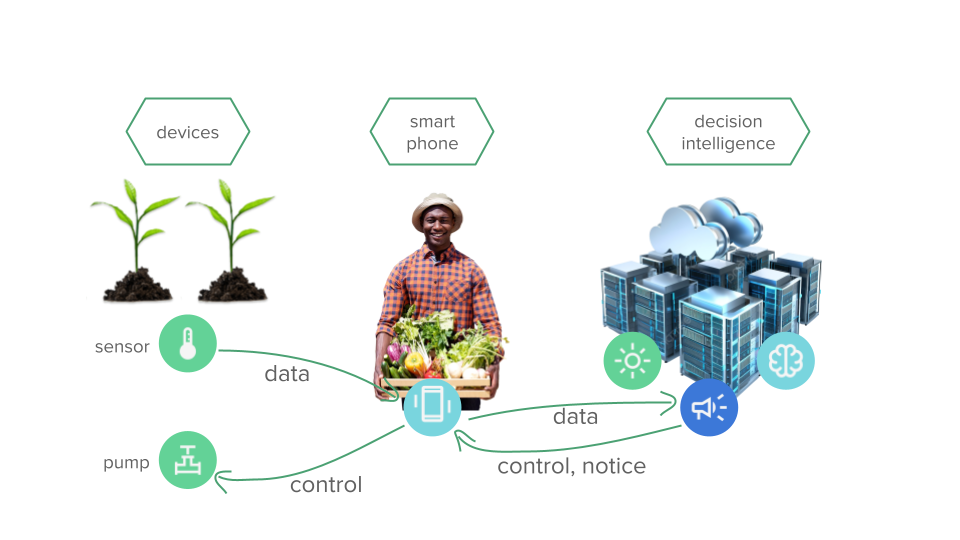
Figure 4.11: A more sophisticated system with a separate device that controls an irrigation pump.
This stage requires the following tasks:
- Measure the distance between water source and crops
- Note the water storage capacity
- Note whether the water is filtered (if not, acquire filtration)
- Design irrigation layout
- Acquisition of pumps and flow sensors
- Acquisition of tubing
- Install tubing and pumps
- Test installation locally with mobile app
4.2.4 Freeze warnings
Farmers and gardeners in temperate or similar climates need to know when there are frosts that could damage fragile seedlings. Uncertainty leads to wasted time preparing for non-events or stress worrying about whether plants will be okay.
Crop tables typically show temperature ranges that specific crops can tolerate.
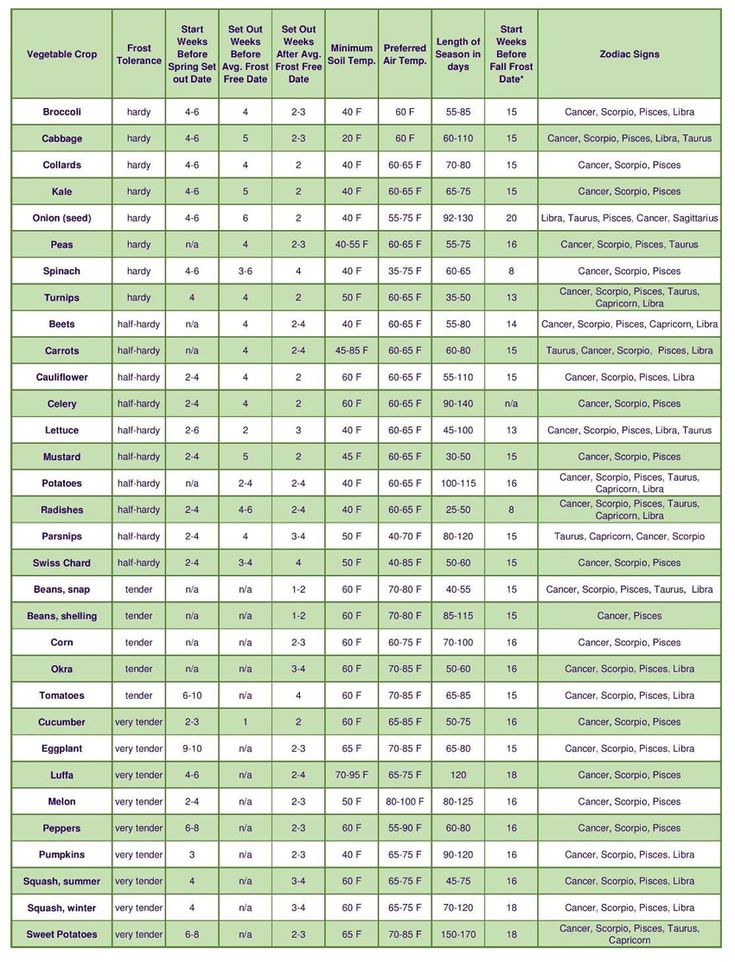
Figure 4.12: Planting guides for different vegetables
References
Brouwer, C., and M. Heibloem. 1986. Irrigation Water Management: Irrigation Water Needs. Food; Agriculture Organization of the United Nations. https://www.fao.org/4/s2022e/s2022e00.htm#Contents.
“Crop Calendars for East Africa.” n.d. USDA. https://ipad.fas.usda.gov/rssiws/al/crop_calendar/eafrica.aspx.
Erraguntla, M., D. Dave, and J. et al. Zapletal. 2021. “Predictive Model for Microclimatic Temperature and Its Use in Mosquito Population Modeling.” Sci Rep 11, 18909. https://www.nature.com/articles/s41598-021-98316-x.
Vanos, J., G. Guzman-Echavarria, and J. W. et al. Baldwin. 2023. “A Physiological Approach for Assessing Human Survivability and Liveability to Heat in a Changing Climate.” Nat Commun 14. https://doi.org/10.1038/s41467-023-43121-5.